Information
Section: Introduction
Goal: Get an insight on the contents, goals and challenges of this course.
Time needed: 10 min
Prerequisites: Curiosity
Introduction
About the course
Did you know that most of the hiring processes in big companies are complemented by some machine learning algorithms, in charge of pre-selecting the best resumes before handing them to a human? (1) That some banks use machine learning to predict whether or not you will be able to reimburse a credit? (2) That most online customer support usually start the interactions with an intelligent agent rather than a human? (3) Because of the vast amount of applications we are confronted to in our daily life, a basic knowledge of data science is essential to understand how decisions are made and what we, as a member of society, can do to maximize the efficiency and minimize the risks of these processes.
That is why public awareness on the field of computer science technology is of great importance, and science enthusiasts should not be the only ones to be informed about these challenges and pitfalls. Education should offer learning opportunities to a broad audience, by creating resources that are understandable with no to little scientific background. With that in mind, we want to design an online course about machine learning that is accessible for everybody, with different levels of difficulty.
Is it for me?
from IPython.display import IFrame
IFrame("https://blog.hoou.de/wp-admin/admin-ajax.php?action=h5p_embed&id=50", "959", "442")
This course addresses whoever is interested to learn more about how data is used in general in nowadays technologies.
Because the course is available as two different levels, beginners in science and programming are more than welcome: the only prerequisite is curiosity in the topic, and ability to understand basic logic and science. No coding is required: you can play around with the data using only sliders and visual interfaces.
For those who like a little more challenge, the advanced level is here: the content is the same as for the beginner level, except that the manipulations are made with coding. For this level, you need to have some basics in programming, but don’t worry: we provide in the introduction some tutorials for beginners who are interested in coding. In general, Python is an easy-to-learn programming language, and in the scope of this course we use it at a light level.
No basic knowledge of machine learning is required here, as we also provide an introduction on the topic. The course focuses on data quality, so the machine learning tasks are kept very simple in this course.
Topics covered by the course
You will learn to detect some errors in data, how they can affect the task they are used for, and how to “repair” them, or mitigate the consequences of bad quality in data.
As data quality can vary much depending on the type of data, we chose to focus on 3 different types of data:
numerical data: data containing mostly numerical values; the simplest type of data to be processed, in this case logistics data (such as AIS data).
image data: a representation of the pixels constituting an image.
text data: a harder task for evaluating data quality, where the information is expressed in natural language (sentences).
Design of the learning arrangement
The course is developed using Jupyter Book, which provides an interactive interface, mixing text content with code cells.
For the beginner level, the code cells are hidden and the interaction happens through text, graphs, sliders, text boxes, and some quizzes come regularly for you to make sure that you understand what you are reading. Everything is online and you do not need to install anything on your personal computer.
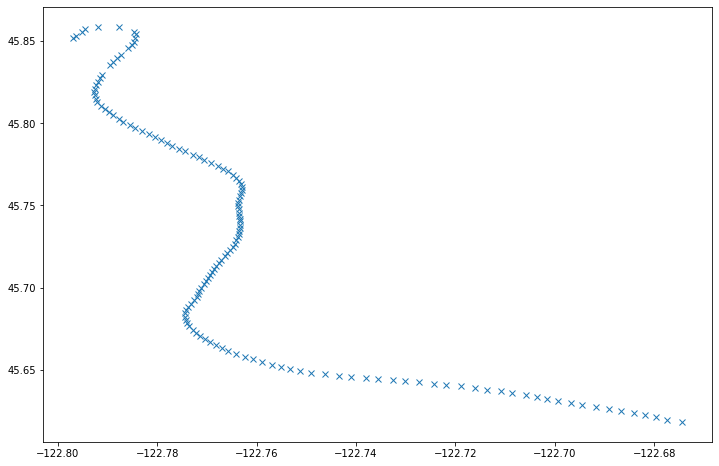
Here is an example of an interactive widget, of the sort of those that will be used in the course. This widget lets you plot the route taken by a ship step by step. Move the slider to visualize the route taken at different times.
# Beginner level: code cell to hide

import pandas as pd
import matplotlib.pyplot as plt
import numpy as np
import ipywidgets as widgets
from ipywidgets import interact

data = pd.read_csv('trip9.csv')

def plot_trip(point):
    df = data.iloc[0 : point]
    plt.figure(figsize = (12, 8))
    plt.xlim(-122.81, -122.67)
    plt.ylim(45.60, 45.87)
    plt.plot(df['LON'], df['LAT'], 'x')

interact(plot_trip,
         point = widgets.IntSlider(
             value = 0,
             min = 0,
             max = len(data),
             step = 1,
             description = 'Points:',
             disabled = False,
             continuous_update = False,
             orientation = 'horizontal',
             readout = True,
             readout_format = 'd'))
<function __main__.plot_trip(point)>
The advanced level can use the interface of Jupyter Book at its fullest: the code cells can be modified, run and re-run directly on the page. Here again, everything happens online. However, if you want to do your own experiments, it is also possible to download the content and the datasets on your personal machine.
For example: here are two interactive code cells that for now allow you to plot the distribution of an attribute of the dataset, and the values of two attributes against each other. Feel free to change the attribute plotted by replacing 'LAT' in the first cell with another attribute, and do the same in the second cell. You can also completely delete the content of the cell and add your own content, or create a bug: try replacing 'LAT' with a random string, for example.
import pandas as pd
data = pd.read_csv('trip9.csv')
# plottable attributes: LAT, LON, SOG, COG, Heading
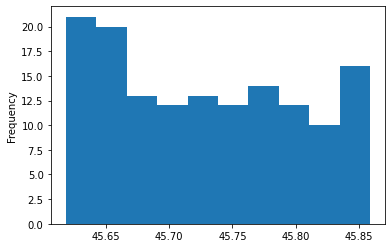
data['LAT'].plot.hist()
<AxesSubplot:ylabel='Frequency'>
plt.figure(figsize = (12, 8))
plt.plot(data['LON'], data['LAT'], 'x')
[<matplotlib.lines.Line2D at 0x7fc6249092e8>]
Prerequisite needed
For the beginner level, no prerequisite is needed, besides curiosity. Of course, without being curious about the topic, it will be hard to follow! But with the appropriate attention, the course is accessible for everyone. In the introduction, we added some content to help you prepare for the course, in case you are missing some basics in science. Good luck!
For the advanced level, it is theoretically possible to also start from scratch, as we propose some tutorials for Python in the introduction. A small background in computer science and coding is however helpful to understand the code presented in the class.
Context of the project
The project is developed by the Institute for Software Systems (STS) at the TUHH, under the supervision of Prof. Sibylle Schupp. The STS institute specializes in the following research fields: model checking and abstract interpretation, software quality and verification, and data protection and machine learning.
The collaborators of QuaXP previously worked on a related project: MaLiTuP (Machine Learning in Theory and Practice), a collaboration between the Institute of Maritime Logistics (MLS) and the STS institute, which successfully developed a beginner course in machine learning for students in maritime logistics. With this project, we gained experience in teaching with Python and Jupyter Notebook, as well as in designing lectures and tasks for beginners in machine learning.