Information
Section: Image representation
Goal: Understand how images are represented in a computer.
Time needed: 20 min
Prerequisites: None
Image representation
First of all, let’s see how an image is stored and represented numerically.
Pixels and colors
An image is made of many pixels, each of them with a particular color. Modern computers can show up to 16.7 millions of different colors. It is impossible to store each one of these colors personnally, they are instead represented as a combination of three primary colors: red, green and blue (RGB color model).
Therefore, for each pixel, we need to store a total of 3 numbers corresponding to the amount of each color. For most computers nowadays, each color can get 256 values (from 0 to 255), 0 being the absence of the color and 255 the highest intensity of it. You will understand better by looking at the following table, showing some examples of colors represented in the RGB model:
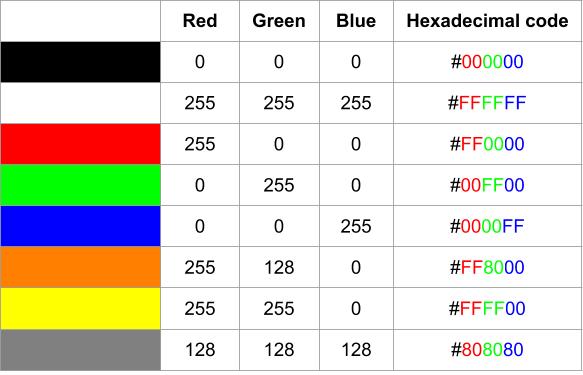
For an easier readability, we can also express those quantities of each color using a hexadecimal code, with 2 digits for each color. The understanding of hexadecimal code is not needed for this lecture, but if you are curious, I invite you to read the additional resources (1) or (2).
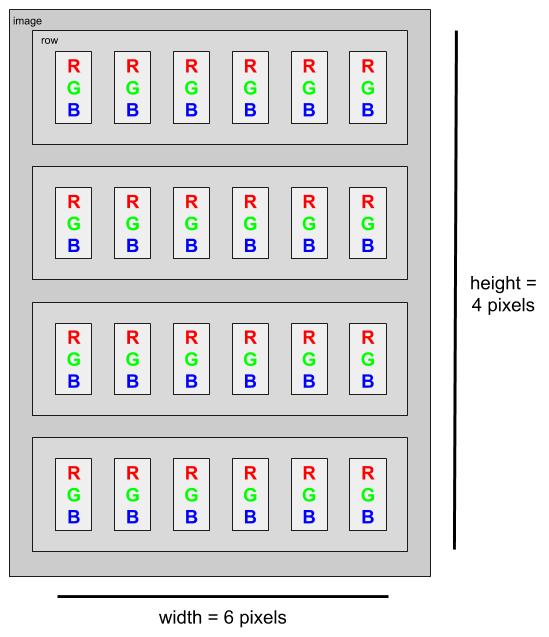
With all this, we understand that to store an image, we need a table representing each pixel, and each pixel must contain 3 values (red, green, blue). We then need a list of lists. Additionally, we need the position of each pixel.
Skimage library
In this course, we will use the library scikit image (skimage) to read and manipulate the images. This library offers a broad range of tools for image processing.
With skimage, the images are stored as a list with each entry containing a row of pixel. Each row is itself a list, with each entry being a pixel. And each pixel is a list of 3 entries, the values for each red, green and blue colors:
Let’s visualize this.
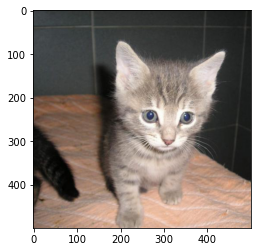
First, we import an image. For that, we use the function io.imread from the skimage library. We print the image with the function imshow of the pyplot library.
import matplotlib.pyplot as plt
from skimage import io

image = io.imread('./data/1.jpg')
plt.imshow(image)
<matplotlib.image.AxesImage at 0x23618dc9ac8>
Now, we can have a look at how the values are stored in image:
image
array([[[ 59,  60,  64],
        [ 60,  61,  65],
        [ 62,  63,  67],
        ...,
        [ 20,  22,  19],
        [ 20,  22,  19],
        [ 20,  22,  19]],

       [[ 60,  61,  65],
        [ 61,  62,  66],
        [ 62,  63,  67],
        ...,
        [ 21,  23,  20],
        [ 21,  23,  20],
        [ 21,  23,  20]],

       [[ 61,  62,  66],
        [ 62,  63,  67],
        [ 63,  64,  68],
        ...,
        [ 23,  25,  22],
        [ 23,  25,  22],
        [ 23,  25,  22]],

       ...,

       [[127,  99,  85],
        [128, 100,  86],
        [129, 101,  87],
        ...,
        [200, 164, 142],
        [199, 164, 144],
        [196, 161, 141]],

       [[125,  97,  83],
        [126,  98,  84],
        [126,  98,  84],
        ...,
        [200, 164, 142],
        [200, 165, 145],
        [199, 164, 145]],

       [[126,  98,  84],
        [125,  97,  83],
        [125,  97,  83],
        ...,
        [199, 163, 141],
        [201, 166, 146],
        [202, 167, 148]]], dtype=uint8)
We see a list of lists of lists, each last list containing 3 values, of for each RGB color. Each sublist represents a row. To make sure about that, let’s look at the dimensions of the list. From the visualization of earlier, we see that the image size is 500*500 pixels.
With len(image) we get the length of the overall list, meaning the height of the picture.
len(image)
500
The first sublist in image represents one row of the image, and its length should be equal to the width of the image.
len(image[0])
500
Finally, if we go one level deeper, we should get a list with a length of 3, containing a value for each color.
len(image[0][0])
3
Let’s have a look at the colors of each corner pixel of the picture. Many websites propose to check the color by its RGB code, we can use for example w3schools.com, where we can enter the values as rgb(x, y, z) with x, y, z the values for each RGB color. Check that the colors you find are concordant with your visual of the picture earlier.
We can access the last element of a list with the index -1.
# Top left corner
print("Top left corner: " + str(image[0][0]))

# Top right corner
print("Top right corner: " + str(image[0][-1]))

# Bottom left corner
print("Bottom left corner: " + str(image[-1][0]))

# Bottom right corner
print("Bottom right corner: " + str(image[-1][-1]))
Top left corner: [59 60 64]
Top right corner: [20 22 19]
Bottom left corner: [126  98  84]
Bottom right corner: [202 167 148]
Quiz
from IPython.display import IFrame
IFrame("https://blog.hoou.de/wp-admin/admin-ajax.php?action=h5p_embed&id=60", "743", "694")
External links
(1): “Hexadecimals” from mathsisfun.com: https://www.mathsisfun.com/hexadecimals.html
(2): “Hexadecimal numbers from the Khan Academy”: https://www.khanacademy.org/computing/computers-and-internet/xcae6f4a7ff015e7d:digital-information/xcae6f4a7ff015e7d:hexadecimal-numbers/a/hexadecimal-numbers